 According to the National Health Care Anti-Fraud Association (NHCAA) and the Blue Cross and Blue Shield Association, the estimated annual costs of health care fraud in the U.S. are more than $70 billion, or about 3% of total national health care expenditures. This is an amount large enough to wipe out the savings from many well intentioned programs. For example, Accountable Care Organizations (ACOs)—one of the key organizational components of the Affordable Care Act (ACA)—are estimated to save only $5.3 billion in the first 10 years of operation.
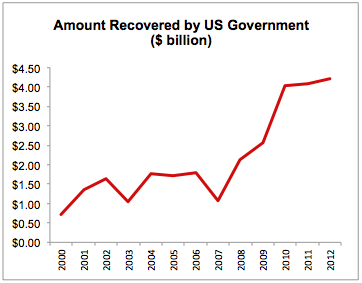
Efforts to fight health care fraud were reinforced in the Health Insurance Portability and Accountability Act of 1996 (HIPAA), which created the national Health Care Fraud and Abuse Control Program (HCFAC). The HCFAC program is designed to coordinate Federal, State and local law enforcement activities with respect to health care fraud and abuse. Under this program, the government has recovered approximately $28 billion from 2000 to 2012 (see Figure). In the most recent year for data available (2012), the government collected $4.2 billion in criminal fines, civil penalties, asset forfeiture, and other penalties.
The HCFAC coordinated an enforcement effort in May 2012 that involved the highest number of false Medicare billings in the history of the program. The enforcement involved 107 individuals (mostly doctors and nurses) in seven cities charged for alleged participation in false Medicare billings totaling more than $450 million. In FY 2012, 251 guilty pleas and 13 jury trials were litigated, with guilty verdicts against 29 defendants. The average prison sentence in these cases was more than 48 months.
According to the NHCAA, the most common forms of medical care fraud are:
These types of fraudulent activity can be detected a number of ways, ranging from traditional law enforcement investigative techniques to complex statistical analysis of administrative data, such as claims data from government programs like Medicare and Medicaid and private commercial insurance carriers. Most of the fraudulent schemes in the list above can be identified to some extent by performing complex statistical analyses of administrative claims data.
The overall aim of statistical analysis in the identification of fraudulent activity is to separate the “expected” from the “unexpected.” Statistical analysis can also identify “outliers”—those cases that look substantially different from other cases. Prior to the advent of computers and information systems able to process massive databases in minutes, the investigation of fraud typically focused on a “manual” examination of outliers. For example, analysts would “dump” all claims or records that had a certain characteristics, and then manually examine each of those records.
Statistical analysis of expected versus unexpected events, however, is quite different. Using complex regression analyses which make use of all of the data available (e.g., medical claims data merged with patient characteristics), statistical models can be used to predict medical care utilization. Statistical models can make use of data on market demand (e.g., patient characteristics, such as age, gender, income, etc.) and supply characteristics (e.g., number of physicians per capita, number of specialists per capita, number of hospital beds per capita, etc.). For these types of models, medical care utilization (Q) can be expressed as a function of market demand (D) and supply (S), such that Q = f (D, S).
If we estimate this model statistically at the national level, we can generate estimates (“coefficients”) of the role of the variables that make up D and S. We can then apply these estimates to models restricted to a given geographic area (or to a given provider or type of provider) and calculate the expected utilization (Q’). These kinds of predictive models can be designed to address the following types of inquiries:
There are many other types of inquiries that be supported by this basic statistical modeling framework; these are just a few examples. Note that in all of these cases, the actual observed level of utilization (Q) is compared to the expected level of utilization (Q’). In any statistical model, there is “error” associated with the estimates. Thus, we generally do not simply look to see whether Q > Q’. There is a margin of error around Q’, so what we are really interested in is whether the magnitude of the difference between Q and Q’ is “statistically significant.” The calculation of statistical significance takes into account the margin of error of Q’, and provides information as to whether the difference between Q and Q’ is statistically different from zero. If Q is significantly greater than Q’, we are observing levels of utilization that are higher than what we would expect.
Unfortunately, this does not signal the end of the investigation. The statistical analysis is only the first step. Although the statistical analysis points to a significant difference in utilization rates, it is necessary to probe deeper. Does the market area or the provider have characteristics that are not sufficiently captured in the prediction model? If we were to replicate the prediction model on a similar provider or in a similar geographic area, would we observe similar differences? Finally, and perhaps most importantly, is the magnitude of the difference large enough to warrant further investigation? The latter is an interesting question because with limited investigative resources, fraud investigators must look not only for significant differences but for differences that are likely having the biggest financial impact—this may be driven by the overall magnitude of the difference between Q and Q’, but also may be driven by the type of medical procedure in question. Small differences in less expensive procedures have less impact on payers than small differences in more expensive procedures.
At Avalon Health Economics ( www.avalonecon.com) we have experts with extensive experience in the kind of predictive modeling discussed in this blog. Our consultants have examined administrative claims data from the Medicare and Medicaid programs and have also worked extensively with private insurance claims data and billing data. We have advised national data providers on methodological issues, and have published numerous peer-revised papers wherein the aforementioned statistical methods have been employed.
(John Schneider, PhD, CEO)